1. Introduction
Due to the nature of the mobile game industry, it isn't easy to find users organically. Mobile game owners or publishers spend most of their marketing budgets on ads needed to acquire users until they arrive organically. In other words, mobile game companies spend all their marketing budget on user acquisition.
In the beginning, targeting the right user segment with optimized ad campaigns and acquiring them is enough. After installing the game to the users, it is important to keep them in the game as long as possible (Higher Retention). So, the longer the users stay, the more profit they leave.
2. Impressive Results
In this case, we would like to present our ongoing partnership with a well-known RPG game.
The goal of the collaboration was to increase the Retention of Players. Therefore, the first step was to distinguish between players who will stay in the game for less than 7-days and those who will stay longer than 7-days.
Then, AppNava’s 7-Day Retention Model was initiated for Newcomers.
After the player finished the first session, AppNava detected who would leave the game earlier (play less than 7-days). These players have been separated into two different groups for the A/B test.
The following results were obtained in Group B, determined to quit the game early and awarded a gift.
Let’s dive deeper into this amazing result;
3. Previous Situation of Game
At the beginning of the test, the 7-Day Retention Rate was 26%.
The scope of the test is the analysis of Players who are likely to leave the game within the first 7-days.
The AI-based retention model learning period ranges from April 1 to April 30, 2021. In total, 1.432.326 Players have been analyzed.
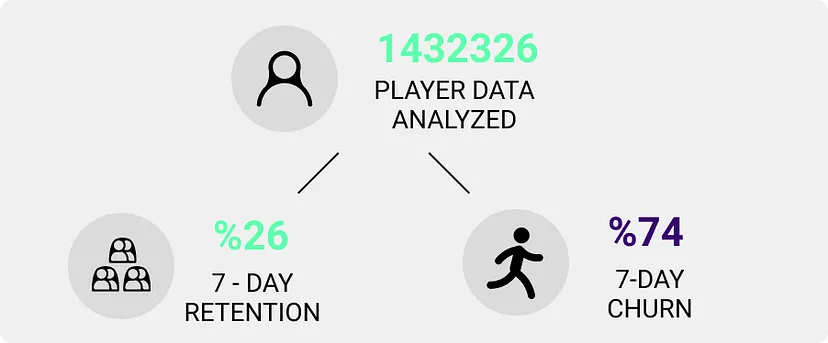
According to the general player behavior in the data, 74% of the players played the game for less than 7 days. 26% played the game for more than 7 days (7-Day Retention: 26%)
4. Modeling Player Churn
Players identified to play the game for less than 7-days have been subdivided into two control groups to determine which instruments inspire players to spend a longer time in the game.
We hypothesized that a non-consumable in-game gift would motivate players to play longer.
So, Group B (Green Bar) players have been awarded gifts, while no gifts have been awarded to players from Group A (Red Bar). At the end of the test, the two most crucial in-game metrics, Retention and Live Time Value (LTV) showed observable improvements.
Retention Improvement
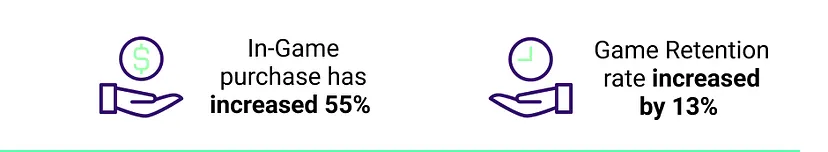
The game's retention rate increased by 13% as a result of accurately predicting players who will leave the game and awarding them with a gift.
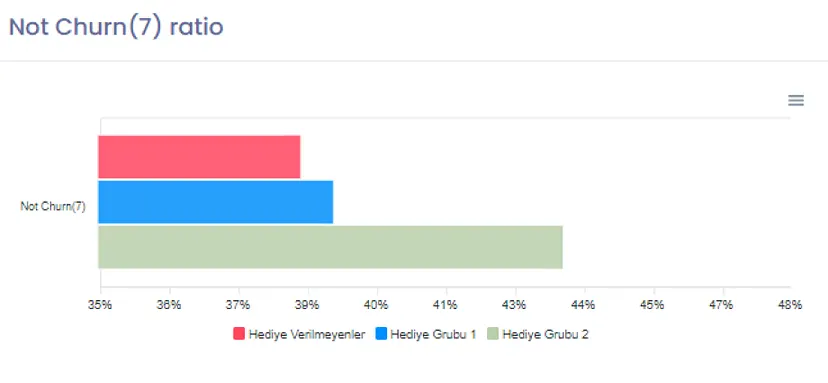
Group A exhibited a retention rate of 38% (62% of the players from group A left the game), while Group B, which received a gift, showed an increased retention rate of 44% (who have been awarded a gift)
Life Time Value (LTV) Improvement
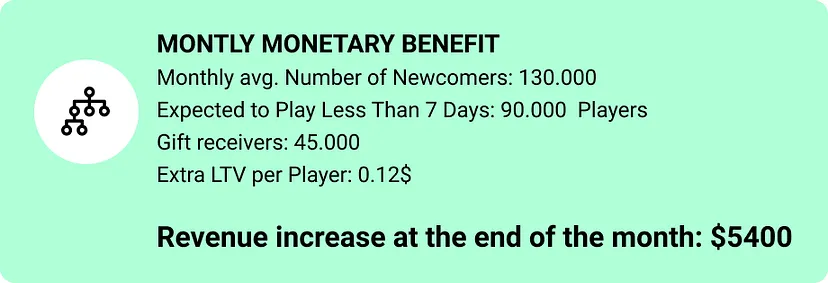
The average LTV per Player increased by 55% in Group B by accurately identifying their retention behavior and awarding gifts.
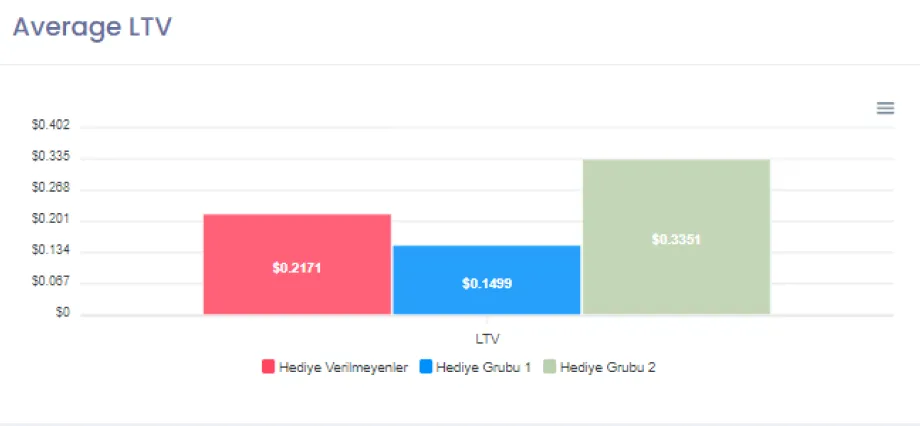
The average LTV per Player of Group A (Red Bar) is 0.22$, while the average LTV per Player of Group B (Green Bar), who received a gift, is 0.34$.
Added Value
In the end, their monthly Revenue increased by $5400.